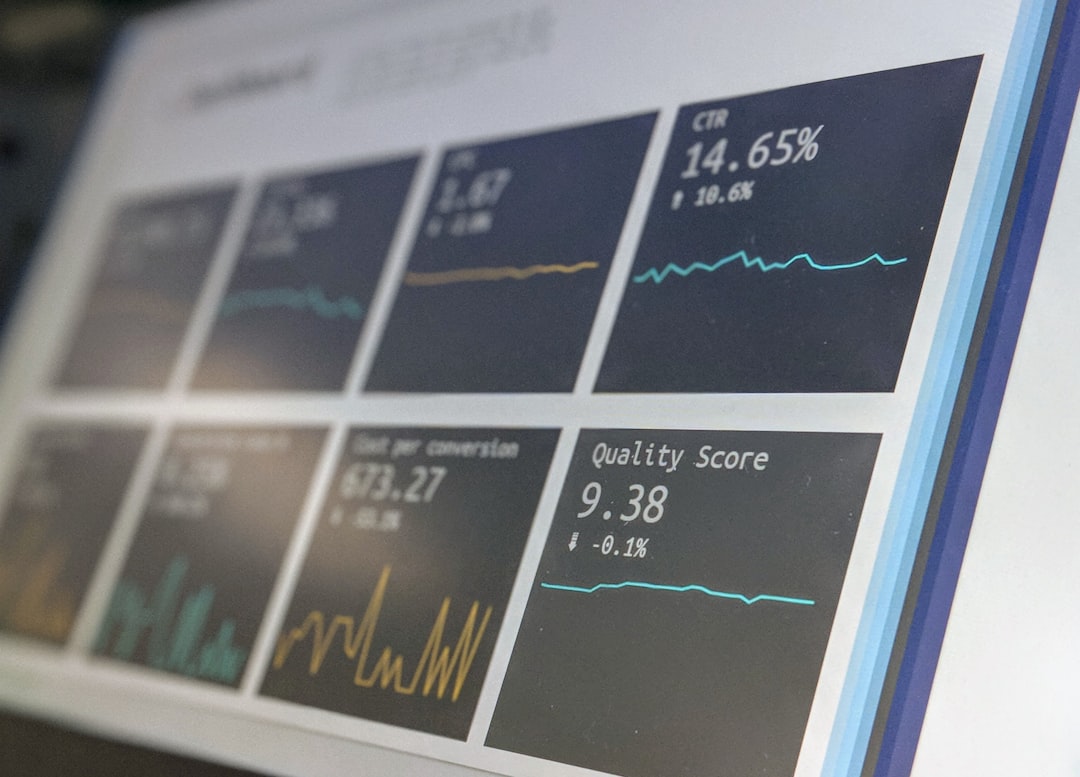
If you’re on a product-led team, you’ve probably heard of Cloudflare. Maybe you’re using it already. Maybe someone just dropped the name in a Slack message. Either way, this deep dive into the Cloudflare Dashboard will help you understand why it matters, and how it can empower your product decisions, all while making your team’s life way easier.
What is the Cloudflare Dashboard?
Cloudflare is more than just a fancy CDN. The dashboard is your control center. It’s the place where you tweak, monitor, and secure your traffic. Think of it as mission control for your digital product. Here, you can:
- Check traffic in real time
- Enable security rules to block bad actors
- Speed up your app with optimization settings
- Monitor usage trends and performance stats
Pretty cool, right?
Why Product-Led Teams Should Care
If your product grows through users discovering value on their own, uptime, speed, and trust are key. Slow apps kill engagement. Bots and DDoS attacks ruin customer journeys. The Cloudflare Dashboard helps you stay ahead of all that.
Instead of waiting for reports from devs or ops teams, product managers and growth teams can peek into performance themselves.
You get visibility, control, and confidence. All wrapped in a sleek web interface.
Getting Started: A Quick Tour
When you log in to the Cloudflare Dashboard, you land on a list of your websites or products. Click on one, and you’re taken to its Overview page.
- Overview: A snapshot of your current traffic. Here you can see hits, threats blocked, and caching stats.
- Analytics: Dive deeper into performance, threat data, and traffic patterns over time.
- Speed: Tools like Brotli compression and image optimization live here.
- Firewall: Set up rules to block traffic from certain countries or bots.
- DNS: Easily configure your records, with zero downtime.

The Power of Analytics for Product Teams
This is where it gets exciting. Click on the Analytics tab and boom—charts. Lots of them. But don’t worry, they’re friendly ones.
You’ll see:
- Traffic Trends: Know when users spike and where they come from.
- Threats: Spot malicious traffic trying to abuse your signups or APIs.
- Cache Performance: Identify how much you’re saving in bandwidth and speed.
Product teams can use this data to plan feature rollouts or troubleshoot user complaints. Did your new home page slow things down in Europe? The charts will tell you.
Security Made Simple (and Scalable)
No one wants to deal with DDoS attacks, spam bots, or weird login patterns at 3 a.m. Cloudflare makes it easy to set up rules with just a few clicks.
There’s a tab called Firewall. Here you can:
- Block specific countries or IPs
- Challenge users when suspicious activity is detected
- Set up custom rules — like blocking traffic with empty HTTP headers
You can also look at Managed Rules, which are automatically updated for modern threats. This means you don’t need to be a security expert to protect your customers and features.
Product-Led Growth = Fast Experiences
Speed is UX. And speed is growth. A slow-loading product doesn’t just annoy users—it kills conversion. The Speed section of the Cloudflare Dashboard is magic for this.
You can activate things like:
- Auto Minify: Shrinks JavaScript, CSS, and HTML
- Rocket Loader: Boosts loading time for JavaScript-heavy apps
- Image Optimization: Automatically resizes images for mobile users
- Argo Smart Routing: Routes traffic on the fastest possible path
Tools like this help users feel your product is fast, even on slow networks. No more waiting for dev sprints just to tweak one setting.
Real-Time Alerts for Real-Time Response
Want alerts when something goes wrong? You got it. Cloudflare lets you configure alerts for:
- Traffic anomalies
- New security threats
- Changes in origin response time
Set it and forget it. If something breaks, you’ll be the first to know—without poking engineers for a status update.
Roles and Permissions (Perfect for Teams)
Not everyone needs to touch everything. Thankfully, Cloudflare understands teams.
You can set Roles and Permissions for each dashboard user. Let marketing monitor analytics, give engineers access to DNS, and restrict who can change firewall rules.
This avoids chaos and keeps things simple.
Image not found in postmeta
Integrations That Play Nicely
The Cloudflare Dashboard works well with your existing tools. You can connect to:
- Slack or email for alerts
- Webhooks for automating workflows
- GitHub for managing Workers scripts
There’s also an API, so advanced teams can automate everything — from firewall rules to DNS rewrites. It’s flexible, powerful, and made for modern dev stacks.
Bonus: Cloudflare Workers + Pages
Want to run serverless functions right at the edge? Use Cloudflare Workers. Want to deploy your app with a click? Use Cloudflare Pages.
Both are integrated inside the dashboard.
This is great for product-led teams experimenting with MVPs, beta rollouts, or A/B tests. You don’t need a DevOps army anymore. You log in, click around, and deploy!
Final Thoughts
The Cloudflare Dashboard isn’t just for engineers. It’s a powerful tool for product-led teams who want insights, speed, and security — all in one place.
You don’t need to be a tech wizard. You just need curiosity and a browser.
Try poking around in the dashboard. You’ll be amazed how much you can do with just a few clicks.
Cloudflare turns the complicated stuff into simple switches and clear charts. And that’s empowering for everyone on a product team.
Security, speed, and visibility — now that’s product-led power.


