Imagine your business is a busy kitchen. Orders fly in. Ingredients sit in many places. Chefs need answers fast. A data warehouse is like a giant, clean pantry for your company’s data. It helps everyone find the right information without digging through messy drawers.
TLDR: A data warehouse stores data from many systems in one clean place. It is built for reporting, dashboards, and smart business decisions. It usually has layers for collecting, storing, organizing, and using data. The big benefits are speed, trust, history, and better decision making.
What Is a Data Warehouse?
A data warehouse is a central place to store business data. It pulls data from many sources. Then it cleans it. Then it organizes it. Then people can use it to answer questions.
Think of it as a library for business facts. Each book has a place. Each shelf has a label. You do not need to run around the building to find one answer.
Companies use data warehouses to answer questions like:
- Which products sell the most?
- Which customers buy again?
- Which ads bring in revenue?
- Which regions are growing?
- Where are costs going up?
Without a data warehouse, these answers may live in many systems. Sales data may be in a CRM. Order data may be in an ecommerce tool. Marketing data may be in ad platforms. Finance data may be in accounting software. That can get messy fast.
A data warehouse brings those facts together. It gives teams a shared version of the truth. That sounds fancy. It really means this: people stop arguing about which spreadsheet is correct.
Why Not Just Use a Regular Database?
This is a great question. A regular database is often used to run an app or system. For example, an online store needs a database. It stores customers, carts, orders, and payments. It must be fast for daily actions.
A data warehouse has a different job. It is built for analysis. It is made for big questions. It is great at reading large amounts of data and summarizing it.
Here is the simple difference:
- Operational database: Helps run the business right now.
- Data warehouse: Helps understand the business over time.
One handles action. The other handles insight. Both are useful. They just play different roles.
The Core Idea: One Place for Many Sources
Data comes from everywhere. It can come from apps, websites, stores, sensors, payments, emails, and support tickets. Each source may speak its own language. One system may call a customer “client.” Another may call the same person “account.” A data warehouse helps translate all that.
The goal is simple. Bring data together. Make it clean. Make it useful. Make it easy to explore.
This process often includes:
- Extract: Take data from source systems.
- Transform: Clean and format the data.
- Load: Put the data into the warehouse.
This is called ETL. Sometimes teams use ELT instead. That means they extract, load, and then transform. The letters move around. The idea stays the same. Data gets moved and prepared.
Data Warehouse Architecture, Made Simple
Architecture sounds serious. It can feel like a word wearing a suit. But the idea is simple. It is the layout of the data warehouse. It shows how data moves from source to insight.
Most data warehouse architecture has a few key parts.
1. Data Sources
These are the places where data begins. Sources can include:
- CRM systems
- ERP systems
- Web analytics tools
- Mobile apps
- Payment platforms
- Support tools
- Spreadsheets
Yes, spreadsheets count. They are everywhere. They are like glitter. Once they enter a business, they never fully leave.
2. Data Ingestion
Ingestion means bringing data in. It is the “come on in” door. Data can arrive in batches. That means it loads on a schedule. For example, every hour or every night.
Data can also arrive in real time. That means it flows in as events happen. This is useful for live dashboards, fraud detection, and fast alerts.
3. Staging Area
The staging area is a temporary workspace. Data lands here before it is polished. It may still be messy. It may have duplicates. It may have missing values.
Think of it as a prep table in a kitchen. You wash, chop, and sort ingredients before cooking. Nobody serves dinner from the prep table. But it is very important.
4. Data Transformation
This is where the magic broom comes out. Data gets cleaned. Names get fixed. Dates get formatted. Duplicates get removed. Bad records get flagged.
Transformation can also combine data. For example, online sales and store sales may become one sales view. This helps leaders see the full picture.

5. Storage Layer
This is the heart of the warehouse. Clean data is stored here. It is usually organized for fast analysis. It may be split into tables. Those tables can connect to each other.
Many modern warehouses live in the cloud. Popular examples include Snowflake, BigQuery, Redshift, and Azure Synapse. Cloud warehouses can scale up or down. That means you can handle more data when needed.
6. Data Models
A data model gives structure to the data. It makes the warehouse easier to use. Common models include star schema and snowflake schema.
Do not worry. These names sound colder than they are.
A star schema has one main fact table in the middle. Around it are smaller dimension tables. It looks a bit like a star. The fact table may hold sales. The dimension tables may hold dates, products, customers, and locations.
This setup is simple and fast. It helps reporting tools work well.
7. Analytics and Reporting Layer
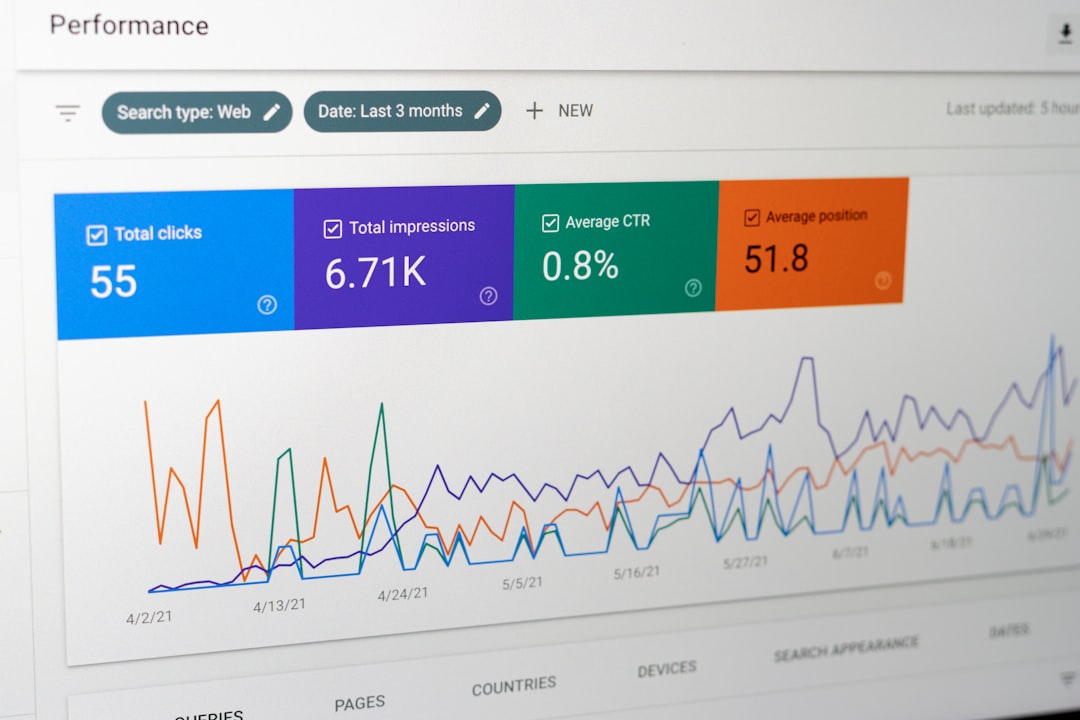
This is where people use the data. Tools connect to the warehouse. Then teams build dashboards, charts, and reports.
Common users include:
- Business analysts
- Finance teams
- Marketing teams
- Sales managers
- Product teams
- Executives
This is the fun part. Data turns into answers. Answers turn into action.
Data Warehouse vs. Data Lake
You may hear about a data lake. It sounds relaxing. Maybe there are ducks. Sadly, it is still about data.
A data lake stores raw data. It can store structured data, semi structured data, and unstructured data. That means tables, logs, images, audio, and more. It is flexible. It is huge. It can also get messy if not managed well.
A data warehouse stores clean, structured, organized data. It is built for reporting and analytics.
Here is the quick version:
- Data lake: Raw data, many formats, very flexible.
- Data warehouse: Clean data, structured format, ready for analysis.
Many companies use both. The lake stores everything. The warehouse serves trusted answers.
Key Benefits of a Data Warehouse
1. Better Decisions
Good decisions need good data. A warehouse lets leaders see trends. It helps teams spot problems. It shows what is working and what is not.
Instead of guessing, teams can ask the data. That is much better than asking the loudest person in the meeting.
2. Faster Reporting
Manual reports take time. People copy data. They paste data. They fix formulas. Then someone asks for “just one small change.” The room goes quiet.
A data warehouse speeds this up. Reports can refresh on their own. Dashboards can update often. Teams save hours each week.
3. One Version of the Truth
This is a big one. Different teams often use different numbers. Sales has one total. Finance has another. Marketing has a third. Everyone looks nervous.
A warehouse creates shared definitions. Revenue means the same thing everywhere. Customer count means the same thing everywhere. This builds trust.
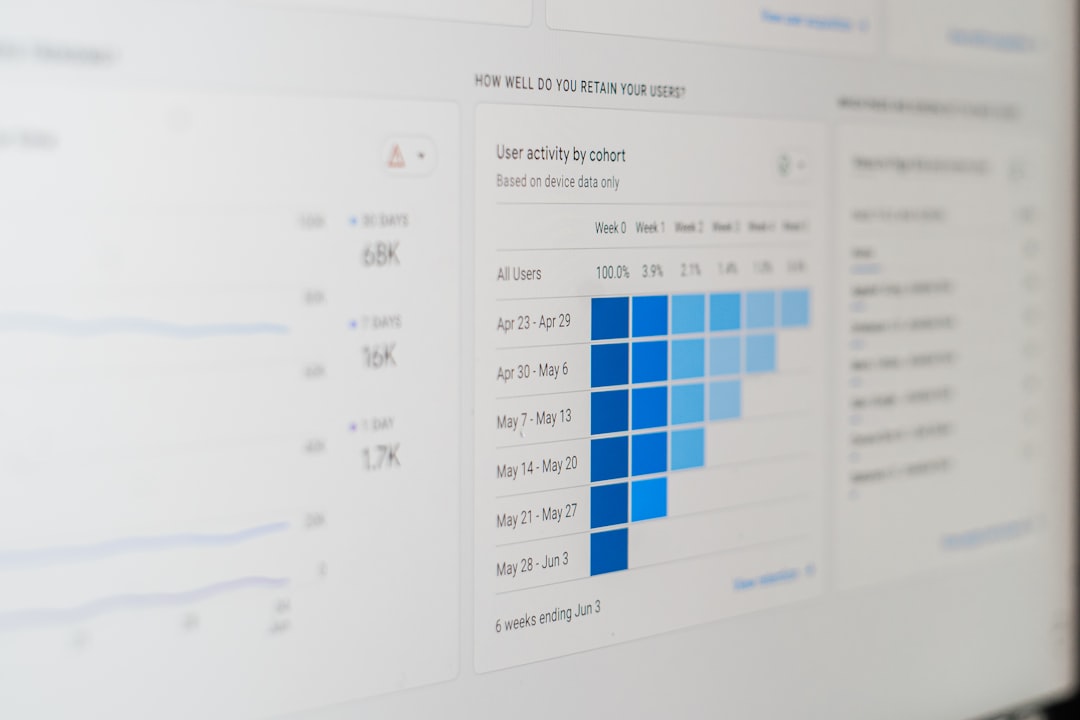
4. Historical Analysis
Operational systems often focus on the present. A warehouse keeps history. That lets you compare this month to last month. Or this year to last year.
History helps reveal patterns. It shows seasonality. It shows growth. It also shows when something weird happened. Weird is useful. Weird teaches lessons.
5. Stronger Data Quality
Data warehouses usually include cleaning rules. They catch errors. They remove duplicates. They format fields. They make data easier to trust.
Clean data is like clean glasses. You see better.
6. Easier Self Service Analytics
Self service means users can explore data without asking engineers every time. This is great for speed. It also keeps technical teams from becoming report vending machines.
With the right setup, business users can filter, sort, and explore. They can answer many questions on their own.
Common Data Warehouse Terms
Let’s decode a few common terms.
- Fact table: A table with measurable events. Sales, clicks, and orders are facts.
- Dimension table: A table with details. Customers, products, and dates are dimensions.
- Schema: The structure of tables and relationships.
- ETL: Extract, transform, load.
- ELT: Extract, load, transform.
- Data mart: A smaller data warehouse for one team or topic.
- Metadata: Data about data. It explains source, meaning, and format.
Who Uses a Data Warehouse?
Almost every department can use one.
Marketing can track campaigns. It can see which channels bring good customers. Sales can study deals and pipeline health. Finance can review revenue and costs. Operations can find delays and bottlenecks. Product teams can learn how users behave.
The warehouse becomes a shared brain. Not a scary robot brain. More like a helpful office brain with charts.
How to Start with a Data Warehouse
You do not need to boil the ocean. Please do not boil oceans. Start small.
- Pick a business question. Choose something valuable.
- Find the needed data sources. Keep the first project focused.
- Move the data into the warehouse. Use reliable pipelines.
- Clean and model the data. Make it easy to understand.
- Build a dashboard or report. Give users something useful.
- Improve over time. Add sources and use cases slowly.
A good first project might be sales reporting. Or customer retention. Or marketing performance. Pick a question people care about. That creates momentum.
Best Practices to Remember
- Define key metrics clearly. Everyone should agree on meanings.
- Track data quality. Bad data can sneak in.
- Control access. Not all data is for everyone.
- Document everything. Future you will be grateful.
- Design for users. The warehouse should be useful, not just impressive.
- Monitor costs. Cloud power is great, but it is not free candy.
Final Thoughts
A data warehouse is not just a storage box. It is a decision machine. It gathers data from many places. It cleans it. It organizes it. Then it helps people see what is happening.
The best part is simple. A data warehouse turns confusion into clarity. It helps teams move faster. It helps leaders make better calls. It helps businesses learn from their own story.
If your company has data scattered everywhere, a warehouse can be a game changer. Start with one question. Build one useful report. Then grow from there. Soon, your data pantry will be tidy, stocked, and ready for action.
