Modern web applications demand speed, responsiveness, and reliability. Users expect pages to load instantly, interactions to feel seamless, and interfaces to respond without delay. As JavaScript continues to power increasingly complex frontend architectures, performance monitoring has become a critical discipline rather than an afterthought. Effective JavaScript performance monitoring tools allow development teams to identify bottlenecks, diagnose issues in production, and systematically optimize the frontend experience.
TLDR: JavaScript performance monitoring tools help teams measure, analyze, and improve frontend performance in real-world conditions. They provide visibility into metrics such as load times, rendering delays, memory usage, and user interactions. By using a combination of browser-based tools, real user monitoring platforms, and synthetic testing solutions, teams can proactively detect bottlenecks and deliver faster, more reliable user experiences.
Why Frontend Performance Monitoring Matters
Performance directly affects user engagement, conversion rates, and brand perception. Research consistently shows that even small delays in page load or interaction readiness can significantly increase bounce rates. In competitive markets, milliseconds matter.
From a technical standpoint, modern JavaScript applications often involve:
- Large bundled JavaScript files
- Third-party scripts and tracking tools
- Complex state management systems
- Dynamic rendering and client-side routing
Each of these elements can introduce performance degradation if not carefully monitored and optimized. A structured approach to performance monitoring provides teams with actionable data instead of assumptions.
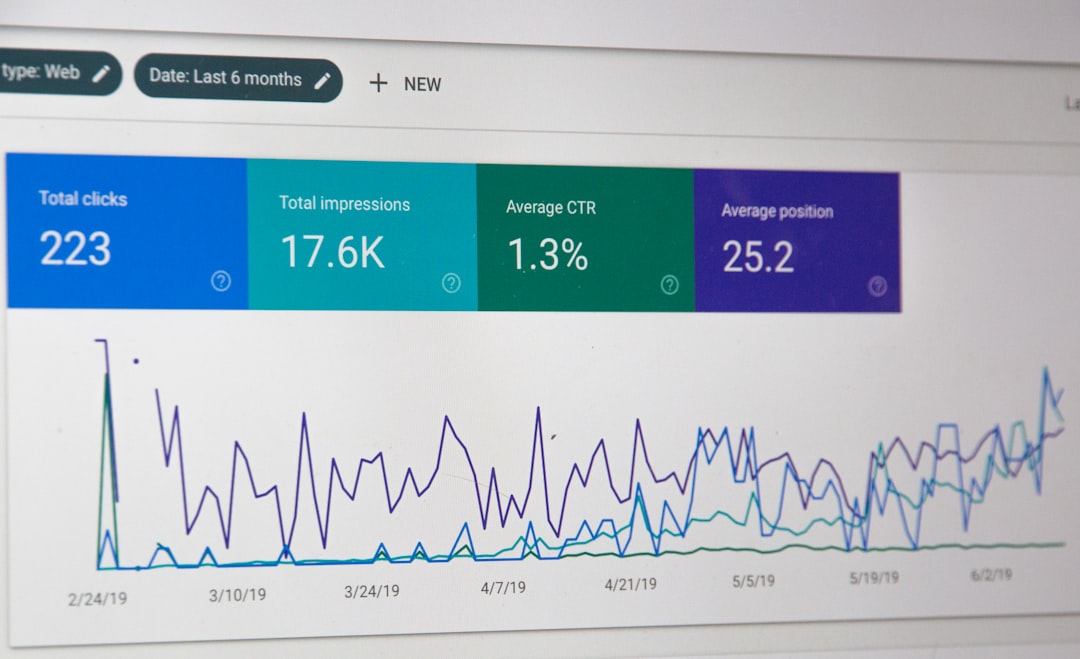
Core Metrics to Monitor
Before selecting tools, it is essential to understand what should be measured. Key frontend performance indicators include:
- First Contentful Paint (FCP): When the first visible element appears.
- Largest Contentful Paint (LCP): When the main content becomes visible.
- Time to Interactive (TTI): When a page becomes fully usable.
- Cumulative Layout Shift (CLS): Visual stability of the layout.
- Total Blocking Time (TBT): Time during which the main thread is blocked.
- JavaScript execution time: Time spent parsing and executing scripts.
- Memory usage and leaks: Long-term browser resource consumption.
Monitoring tools should offer visibility into these metrics under realistic user conditions, not just in controlled lab environments.
Built-in Browser Tools for JavaScript Profiling
Modern browsers provide powerful built-in performance analysis capabilities. Chrome DevTools, Firefox Developer Tools, and similar platforms allow in-depth inspection of JavaScript behavior.
Key capabilities include:
- Performance panel profiling for recording and analyzing runtime activity
- Flame charts to identify long tasks and blocking scripts
- Memory snapshots for detecting leaks
- Network waterfalls to examine resource loading sequences
These tools are indispensable during development and debugging phases. Engineers can record sessions, isolate heavy functions, and inspect event handlers that degrade responsiveness.
Image not found in postmetaHowever, while browser tools are excellent for local debugging, they lack large-scale production visibility. This is where specialized monitoring solutions become essential.
Real User Monitoring (RUM) Solutions
Real User Monitoring tools collect performance data from actual users in real-time production environments. Unlike synthetic tests, RUM captures diverse variables such as:
- Device types and hardware constraints
- Network conditions
- Geographical differences
- Browser variations
RUM platforms typically inject scripts into the application to collect data related to load times, JavaScript errors, and interaction timing. This allows teams to observe how performance behaves across real-world scenarios.
Advantages of RUM tools include:
- Accurate representation of user experiences
- Detection of regional performance disparities
- Integration with error tracking and logging systems
- Historical trends for performance regression analysis
These tools are especially valuable for identifying issues that do not appear in controlled testing environments, such as performance degradation from third-party scripts or device-specific bottlenecks.
Synthetic Monitoring Platforms
Synthetic monitoring simulates user interactions in controlled environments. It runs predefined scripts to measure performance under repeatable conditions. While it does not replace RUM, it complements it.
Typical capabilities include:
- Scheduled page load tests
- Multi-step transaction simulations
- Geographic performance testing
- Automated performance benchmarking
Synthetic tools are effective for:
- Detecting infrastructure failures early
- Testing staging environments before deployment
- Comparing performance between releases
- Establishing performance baselines

By combining synthetic monitoring with RUM, organizations gain a holistic perspective: predictable benchmarking and real-world variability.
JavaScript Error and Exception Tracking
Performance problems often manifest as unhandled exceptions, failed resource loads, or script crashes. Specialized error monitoring tools track:
- Unhandled promise rejections
- Runtime exceptions
- Stack traces and source maps
- User session replays
When tied to performance metrics, these insights become significantly more powerful. For example, identifying that a specific component slows rendering under certain conditions — and also produces memory leaks — enables precise remediation.
Many advanced platforms correlate JavaScript errors with user impact data, showing how performance issues affect conversion funnels and engagement metrics.
Performance Budgets and Continuous Integration
Monitoring tools are most effective when integrated into development workflows. One proven strategy is implementing performance budgets — predefined limits on metrics such as:
- Maximum bundle size
- Maximum JavaScript execution time
- Allowed number of network requests
- Largest Contentful Paint thresholds
These budgets can be enforced in CI/CD pipelines using automated testing tools. If a pull request increases bundle size beyond a defined limit, the system flags or rejects the build.
This proactive approach prevents incremental performance degradation over time.
Memory Leak Detection and Optimization
Frontend performance is not limited to loading speed. Long-lived single-page applications (SPAs) can suffer from progressive memory growth if objects are not released properly.
Memory profiling tools help detect:
- Detached DOM nodes
- Retained event listeners
- Improper closure references
- Uncleared intervals or timers
Systematic memory analysis ensures that applications remain responsive even after prolonged user sessions. Without such monitoring, applications may feel increasingly sluggish despite initial load performance being optimized.
Best Practices for Effective Monitoring
To derive real value from JavaScript performance monitoring tools, organizations should adopt structured practices:
- Define clear performance KPIs aligned with business goals.
- Monitor continuously, not only during debugging phases.
- Correlate technical metrics with user outcomes such as conversions or engagement.
- Segment performance data by device, region, and browser.
- Regularly review third-party scripts for hidden performance costs.
Additionally, performance monitoring should involve collaboration across development, DevOps, and product teams. Performance is not solely an engineering responsibility; it is a strategic business concern.
Choosing the Right Tool Combination
No single tool covers all needs. A comprehensive frontend performance strategy typically combines:
- Browser profiling tools for development insight
- Real User Monitoring for production visibility
- Synthetic testing for controlled benchmarking
- Error monitoring for stability correlation
The appropriate mix depends on application complexity, user base diversity, and organizational scale. Enterprise applications require enterprise-grade aggregation and alerting capabilities, while smaller projects may rely primarily on browser-based diagnostics and lightweight analytics integrations.
Conclusion
JavaScript performance monitoring tools are essential for maintaining modern frontend excellence. As applications grow more sophisticated, the margin for performance inefficiencies shrinks. Monitoring enables data-driven optimization instead of reactive troubleshooting.
By systematically measuring load times, execution behavior, memory consumption, and real user experiences, organizations can identify inefficiencies early and address them methodically. A disciplined monitoring strategy does more than improve technical metrics — it strengthens user satisfaction, increases engagement, and builds durable digital credibility.
In an environment where user expectations continue to rise, persistent and structured performance monitoring is not optional. It is foundational to delivering fast, stable, and scalable frontend applications.
