 logo
logo
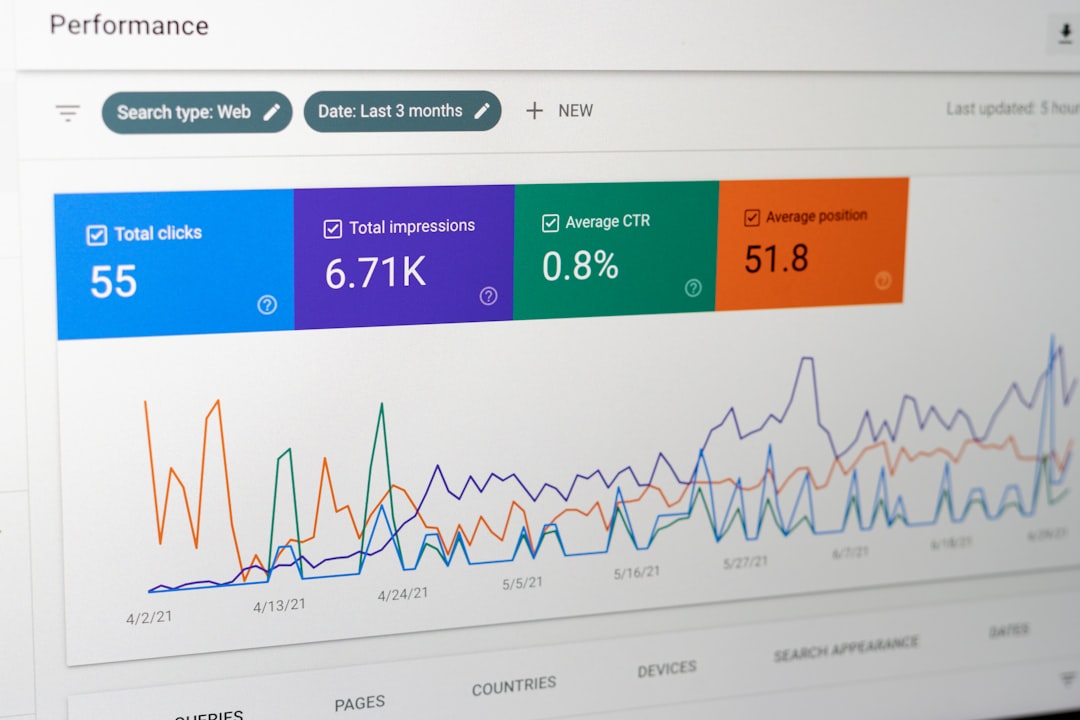
A good search engine ranking report should show money, clicks, and intent, not just keyword positions. Rank is useful. But rank alone is like checking the scoreboard after only one minute of a game. You need the full picture to know if organic search is actually working.
TLDR: Track rankings, but also track clicks, impressions, click through rate, conversions, landing pages, search intent, and revenue. For example, a page may drop from position 3 to 5, but still gain 28% more clicks because the search result got a better title. One small ecommerce site saw organic traffic rise by 18% while average rank stayed almost flat. That is why position is only one clue, not the whole answer.
Why Position Is Not Enough
Keyword rank feels simple. You search a phrase. You see where your page sits. Nice and clean.
But Google results are not clean anymore. They are packed with ads, maps, videos, shopping boxes, images, snippets, and “People also ask” boxes. So being “position 2” may not mean you are the second thing people see.
Honestly, it feels like some reports are built to make teams feel busy, not smarter. You get 300 keyword rows. Green arrows. Red arrows. Tiny panic attacks. But no clear answer to the best question:
Are we getting more useful organic traffic?
That is the question your report must answer.

Start With Business Outcomes
Before you open a rank tracker, start with outcomes. Organic SEO should help the business. That means your report should include goals like:
- Leads from organic search
- Sales from organic visitors
- Demo requests or form fills
- Email signups
- Phone calls
- Revenue from SEO traffic
If rankings rise but leads fall, something is off. Maybe the wrong keywords improved. Maybe the page loads slowly. Maybe the content attracts curious readers, not buyers.
That is why every ranking report needs a business section near the top. Not buried on page 14. Put the real stuff first.
Track Organic Clicks
Clicks show how many users reached your site from search. This is usually more useful than rank.
A keyword may sit at position 1 and bring only 12 clicks a month. Another may sit at position 7 and bring 900 clicks. Which one matters more? The second one, most likely.
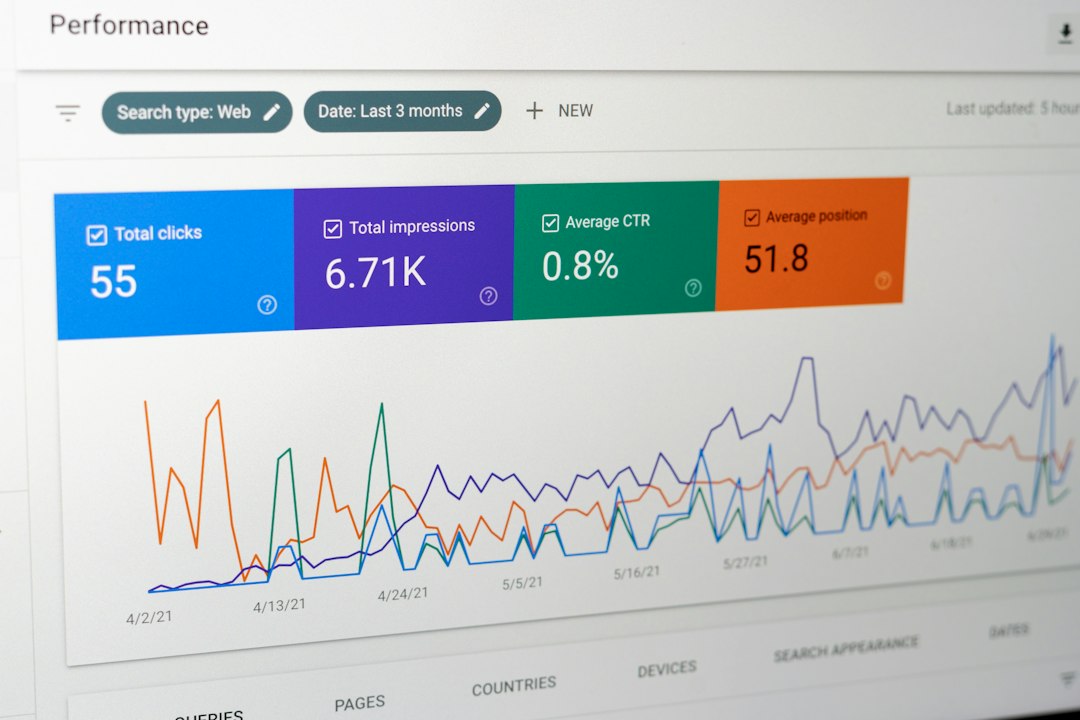
Use Google Search Console to track clicks by:
- Query
- Page
- Country
- Device
- Date range
Compare clicks month over month and year over year. Year over year is helpful because many sites have seasonal traffic. A tax site will not act the same in April and August. Shocking, I know.
Track Impressions
Impressions show how often your pages appear in search results. This is a great early sign.
If impressions rise, Google is showing your content more often. That can happen before clicks rise. It can also show that a topic is gaining demand.
But impressions can trick you. A page may get 50,000 impressions and only 200 clicks. That sounds painful. It also tells you something useful. Your result may need a better title, a clearer description, or a more helpful angle.
Simple rule: rising impressions plus flat clicks means people see you, but do not choose you.
Watch Click Through Rate
Click through rate, or CTR, is the percent of impressions that turn into clicks.
Here is the tiny math:
CTR = clicks ÷ impressions × 100
If a page gets 10,000 impressions and 500 clicks, the CTR is 5%.
CTR is affected by rank. But it is also affected by your title, description, brand name, rich results, and what else appears on the page.
It drives me a little mad when SEO tools show rank changes in bright red but hide CTR three clicks deep. CTR can explain the real story in seconds.
Try testing better title tags. Make them clear. Add a benefit. Match the searcher’s need. Avoid cute wording if it confuses people.
Separate Branded and Non Branded Search
Branded searches include your company name. Non branded searches do not.
Both matter. But they tell different stories.
- Branded traffic shows demand for your business.
- Non branded traffic shows your reach with new people.
If total organic traffic is up 40%, that sounds great. But what if almost all of it came from people searching your brand after a big ad campaign? Then SEO did not do all the work.
Your report should split these two groups. Keep it simple. One chart for branded. One chart for non branded. Then nobody has to guess.
Track Rankings by Intent
Not all keywords are equal. Some users want to buy. Some want to compare. Some want a quick answer and will leave in five seconds.
Group keywords by intent:
- Informational: “how to clean leather shoes”
- Commercial: “best leather shoe cleaner”
- Transactional: “buy leather shoe cleaner”
- Local: “shoe cleaner near me”
A drop on an informational keyword may not hurt much. A drop on a high converting keyword can sting.
This is where a ranking report gets smarter. Instead of asking, “Did we move up?” ask, “Did we move up for terms that can bring value?”
Check Landing Page Performance
Keywords are only half the story. Pages do the work.
Your report should show top organic landing pages and how each one performs. Track:
- Sessions
- Engaged sessions
- Conversions
- Revenue
- Bounce or engagement rate
- Average position
This helps you spot winners and weak spots. Maybe one blog post brings 20,000 visits but only 4 leads. Maybe one service page brings 900 visits and 61 leads. The smaller page may be the real hero.
Do not worship traffic. Traffic pays nothing by itself.
Track SERP Features
SERP features are special search result items. They include featured snippets, image packs, video results, map packs, review stars, and shopping results.
These features can steal clicks. They can also send you more clicks if you win them.
Your report should show when your pages appear in:
- Featured snippets
- People also ask
- Local map results
- Image results
- Video results
For some searches, position 4 with a rich result can beat position 2 with a boring blue link. Google is weird like that.
Measure Share of Voice
Share of voice shows how visible you are compared with competitors. It is better than checking one keyword at a time.
Here is a simple example. You track 100 valuable keywords. Your site appears often in the top 10. A competitor appears even more often. Share of voice helps show that gap.
This is helpful for bosses who do not want 100 rows of keyword data. They want the big picture. Are we gaining ground? Are we losing it? Who is beating us?
Include Device and Location Data
Rankings change by device and place. A user on a phone in Chicago may see different results than a user on a laptop in Dallas.
This matters a lot for local businesses. It also matters for sites with international traffic.
Track mobile and desktop separately. Track key regions if location affects sales. Do not mix everything into one average and call it done. Averages hide problems.
For example, your average rank may look stable. But mobile rank may be falling hard. If 72% of your organic traffic comes from phones, that is not a tiny issue.
Watch Conversion Rate From Organic
Organic conversion rate tells you how well SEO traffic turns into action.
A page can rank well and still fail. Maybe the offer is weak. Maybe the call to action is hidden. Maybe the page asks users to fill out a form with 14 fields. Expect people to leave.
Track conversion rate by landing page. Then improve pages with decent traffic and poor results. These are often quick wins.
Note Content Changes and Google Updates
Your report should include short notes. Nothing fancy. Just useful context.
- “Updated pricing page on May 8.”
- “Added FAQ section to three product pages.”
- “Google core update started this week.”
- “Fixed broken internal links.”
Without notes, reports turn into detective work. Three weeks later, nobody remembers what changed. Then everyone guesses. Badly.
A Simple Report Layout
Use this order:
- Business results: leads, sales, revenue
- Organic traffic: clicks and sessions
- Visibility: impressions and share of voice
- CTR: pages and queries with weak click rates
- Rankings: grouped by intent and priority
- Landing pages: winners and problem pages
- SERP features: wins and losses
- Notes: updates, fixes, tests, and events
This format keeps the report useful. It also stops people from obsessing over one keyword that moved down two spots while revenue went up.
The Bottom Line
A search engine ranking report should not be a rank diary. It should be a decision tool.
Track position, yes. But pair it with clicks, impressions, CTR, intent, pages, conversions, revenue, device data, and competitor visibility. Then you can see what is really happening.
If you only track rank, you may miss the win. You may also miss the problem. And that is how teams waste months fixing the wrong thing.